Multiple Choice
Figure 7.11 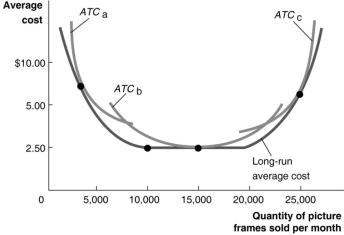 Figure 7.11 illustrates the long-run average cost curve for a firm that produces picture frames.The graph also includes short-run average cost curves for three firm sizes: ATCa, ATCb and ATCc.
-Refer to Figure 7.11.If the firm chooses to produce and sell 25 000 frames per month by operating in the short run with a scale operation represented by ATCc
A) the firm will not be operating efficiently.
B) the firm will be operating efficiently.
C) the firm would lower its average costs by reducing its scale of operation.
D) the firm will not be able to earn a profit.
Correct Answer:

Verified
Correct Answer:
Verified
Q87: Which of the following statements is false?<br>A)An
Q127: What does the production function show?<br>A)The total
Q129: Figure 7.11 <img src="https://d2lvgg3v3hfg70.cloudfront.net/TB1015/.jpg" alt="Figure 7.11
Q131: If diminishing marginal returns have already set
Q160: Explain why the marginal cost of production
Q213: The change in a firm's total cost
Q233: As the level of output increases, what
Q299: Jill Johnson owns a pizzeria. She currently
Q306: What is minimum efficient scale? What is
Q310: Minimum efficient scale is defined as the