Multiple Choice
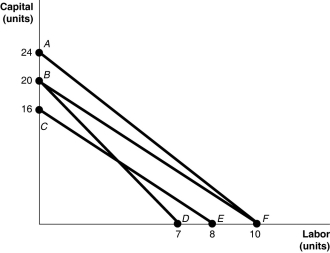
-Refer to Figure 7-13. The lines shown in the diagram are isocost lines. Which of the following shows a decrease in the price of capital while the price of labour remains unchanged?
A) the movement from AF to BF
B) the movement from BF to AF
C) the movement from BF to BD
D) the movement from BF to CE
Correct Answer:

Verified
Correct Answer:
Verified
Q58: An isoquant is a curve that shows
Q86: Table 7.1 <img src="https://d2lvgg3v3hfg70.cloudfront.net/TB1015/.jpg" alt="Table 7.1
Q127: <img src="https://d2lvgg3v3hfg70.cloudfront.net/TB4183/.jpg" alt=" -Refer to Figure
Q135: <img src="https://d2lvgg3v3hfg70.cloudfront.net/TB4183/.jpg" alt=" -Refer to Figure
Q243: Figure 7.17 <img src="https://d2lvgg3v3hfg70.cloudfront.net/TB1015/.jpg" alt="Figure 7.17
Q262: Explain how the listed events (a-d)would affect
Q286: Suppose a chain of convenience stores reorganised
Q293: If 11 workers can produce 53 units
Q301: The level of output at which all
Q316: The typical shape of an isoquant is<br>A)convex