Multiple Choice
Figure 8.7 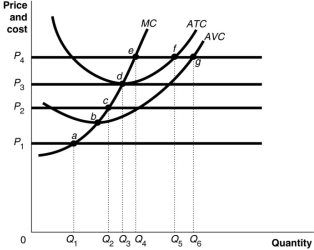 Figure 8.7 shows cost and demand curves facing a profit-maximising, perfectly competitive firm.
-Refer to Figure 8.7.At price P2, the firm would produce
A) Q2 units.
B) Q3 units.
C) Q4 units.
D) zero units.
Correct Answer:

Verified
Correct Answer:
Verified
Related Questions
Q49: The marginal revenue curve for a perfectly
Q64: Consider the market for wheat which is
Q120: A constant-cost, perfectly competitive market is in
Q146: Figure 8.4 <img src="https://d2lvgg3v3hfg70.cloudfront.net/TB1015/.jpg" alt="Figure 8.4
Q149: Why is the demand curve for each
Q150: If the market price is $25 in
Q152: Which of the following could not be
Q155: Assume that firms in a perfectly competitive
Q162: In the short run, if a firm
Q251: In the long run, a firm in