Multiple Choice
Figure 8.10 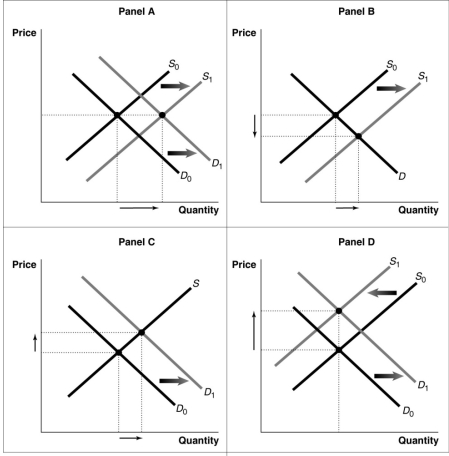
-Refer to Figure 8.10.Consider a typical firm in a perfectly competitive industry that makes short-run profits.Which of the diagrams in the figure shows the effect on the industry as it transitions to a long-run equilibrium?
A) Panel A
B) Panel B
C) Panel C
D) Panel D
Correct Answer:

Verified
Correct Answer:
Verified
Q25: Which of the following is not true
Q195: The price a perfectly competitive firm receives
Q206: In long-run perfectly competitive equilibrium, which of
Q207: Figure 8.5 <img src="https://d2lvgg3v3hfg70.cloudfront.net/TB1015/.jpg" alt="Figure 8.5
Q208: For a perfectly competitive firm, to what
Q209: For a perfectly competitive firm, which of
Q211: A perfectly competitive firm in a constant-cost
Q212: Figure 8.7 <img src="https://d2lvgg3v3hfg70.cloudfront.net/TB1015/.jpg" alt="Figure 8.7
Q213: Figure 8.4 <img src="https://d2lvgg3v3hfg70.cloudfront.net/TB1015/.jpg" alt="Figure 8.4
Q214: Figure 8.4 <img src="https://d2lvgg3v3hfg70.cloudfront.net/TB1015/.jpg" alt="Figure 8.4