Multiple Choice
Figure 9.2 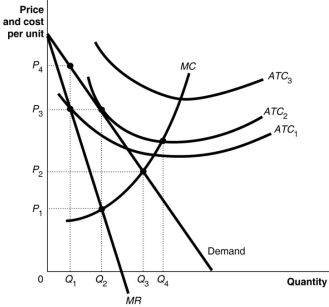 Figure 9.2 above shows the demand and cost curves facing a monopolist.
-Refer to Figure 9.2.If the firm's average total cost curve is ATC3, the firm will
A) suffer a loss.
B) break even.
C) make a profit.
D) face competition.
Correct Answer:

Verified
Correct Answer:
Verified
Q10: The demand curve for the monopoly's product
Q15: When a proposed merger between two companies
Q44: Assume that a monopolist practices perfect price
Q140: What do economists call firms that face
Q141: Figure 9.9 <img src="https://d2lvgg3v3hfg70.cloudfront.net/TB1015/.jpg" alt="Figure 9.9
Q142: A natural monopoly is characterised by large
Q143: To maximise profit, a monopolist will produce
Q145: If a restaurant was a natural monopoly,
Q150: Why do governments grant patents?<br>A)To compensate firms
Q238: What is yield management? How is yield