Multiple Choice
Figure 10.18 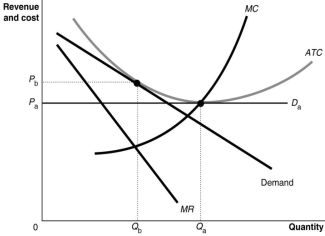
-Refer to Figure 10.18.The diagram demonstrates that
A) in the short run, the monopolistic competitor produces an output Qb, but in the long run after it adjusts its capacity, it will produce the allocatively efficient output, Qa.
B) it is not possible for a monopolistic competitor to produce the productively efficient output level, Qa, because of product differentiation.
C) it is possible for a monopolistic competitor to produce the productively efficient output level, Qa, if it is willing to lower its price from Pb to Pa.
D) in the long run, the monopolistic competitor produces the minimum-cost output level, Qa, but in the short run its output of Qb is not cost minimising.
Correct Answer:

Verified
Correct Answer:
Verified
Q12: A firm cannot control all of the
Q13: Table 10.4 <img src="https://d2lvgg3v3hfg70.cloudfront.net/TB1015/.jpg" alt="Table 10.4
Q14: Being the first to sell a particular
Q17: Figure 10.3 <img src="https://d2lvgg3v3hfg70.cloudfront.net/TB1015/.jpg" alt="Figure 10.3
Q18: Figure 10.12 <img src="https://d2lvgg3v3hfg70.cloudfront.net/TB1015/.jpg" alt="Figure 10.12
Q19: The table below shows the demand and
Q20: Figure 10.4 <img src="https://d2lvgg3v3hfg70.cloudfront.net/TB1015/.jpg" alt="Figure 10.4
Q26: In monopolistic competition there is/are<br>A)many sellers who
Q121: Which of the following is not a
Q210: Firms in monopolistic competition compete by selling