Multiple Choice
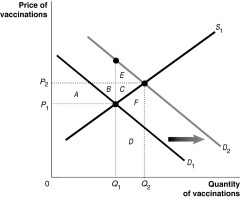
-Refer to Figure 15-6. What does D1 represent?
A) the demand curve reflecting social benefit
B) the positive externalities curve
C) the demand curve reflecting private benefit
D) the social welfare curve
Correct Answer:

Verified
Correct Answer:
Verified
Q13: Assume that emissions from electric utilities contribute
Q22: Figure 15.9 <img src="https://d2lvgg3v3hfg70.cloudfront.net/TB1015/.jpg" alt="Figure 15.9
Q50: Which of the following conditions holds in
Q53: An externality is<br>A) a benefit realised by
Q77: All of the following are examples of
Q96: Ronald Coase was awarded the 1991 Nobel
Q97: Which of the following displays these two
Q143: Figure 15.9 <img src="https://d2lvgg3v3hfg70.cloudfront.net/TB1015/.jpg" alt="Figure 15.9
Q175: Private producers have no incentive to provide
Q189: Figure 5-2 <img src="https://d2lvgg3v3hfg70.cloudfront.net/TB4188/.jpg" alt="Figure 5-2