Multiple Choice
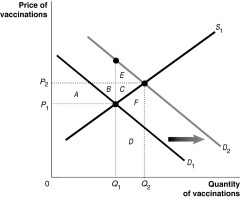
-Refer to Figure 15-6. What does D2 represent?
A) the social welfare curve
B) the demand curve reflecting social benefit
C) the demand curve reflecting private benefit
D) the positive externalities curve
Correct Answer:

Verified
Correct Answer:
Verified
Q25: The demand curve for a public good
Q28: Figure 15.3 <img src="https://d2lvgg3v3hfg70.cloudfront.net/TB1015/.jpg" alt="Figure 15.3
Q40: Figure 15.12 <img src="https://d2lvgg3v3hfg70.cloudfront.net/TB1015/.jpg" alt="Figure 15.12
Q63: The social cost of cutting trees for
Q143: In economics, the optimal level of pollution
Q143: When there is a positive externality,<br>A) the
Q196: <img src="https://d2lvgg3v3hfg70.cloudfront.net/TB4183/.jpg" alt=" -Refer to Figure
Q200: <img src="https://d2lvgg3v3hfg70.cloudfront.net/TB4183/.jpg" alt=" -Refer to Figure
Q247: How does the construction of a market
Q266: A quasi-public good differs from a public