Multiple Choice
Figure 15-7 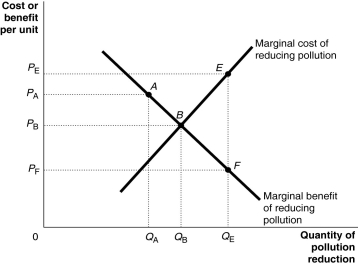
-Refer to Figure 15-7.What is the incremental benefit of increasing the quantity of pollution reduction from QB to QE units?
A) PF
B) PF × QE
C) the value of the area BEF
D) the value of the area QBBFQE
Correct Answer:

Verified
Correct Answer:
Verified
Q7: Which of the following is an example
Q55: Governments can increase the consumption of a
Q69: For the Coase theorem to work there
Q91: Figure 15.9 <img src="https://d2lvgg3v3hfg70.cloudfront.net/TB1015/.jpg" alt="Figure 15.9
Q143: In economics, the optimal level of pollution
Q147: Figure 15.4 <img src="https://d2lvgg3v3hfg70.cloudfront.net/TB1015/.jpg" alt="Figure 15.4
Q155: A positive externality results when<br>A) economists are
Q158: State the Coase theorem.
Q194: The supply curve of a public goods
Q247: How does the construction of a market