Multiple Choice
Figure 15.14 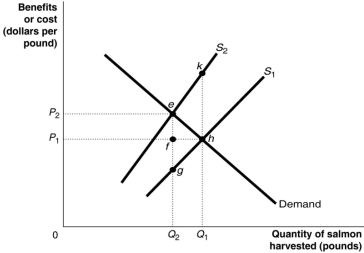 Figure 15.14 shows the market for Atlantic tuna, a common resource.The current market equilibrium output of Q1 is not the economically efficient output.The economically efficient output is Q2.
-Refer to Figure 15.14.Identify the area that shows the deadweight loss from overfishing.
A) egh
B) ekh
C) efh
D) eghk
Correct Answer:

Verified
Correct Answer:
Verified
Q11: The costs in time and other resources
Q56: According to _, in a market with
Q91: How does a public good differ from
Q96: What does it mean if a good
Q97: When does a free market fail?<br>A)When there
Q100: Figure 15.10 <img src="https://d2lvgg3v3hfg70.cloudfront.net/TB1015/.jpg" alt="Figure 15.10
Q101: An important difference between the demand for
Q103: Of what is pollution an example?<br>A)Public good<br>B)Positive
Q111: The social benefit of a given level
Q155: A positive externality results when<br>A) economists are