Multiple Choice
Figure 16.1 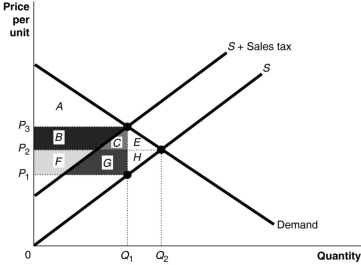
-Refer to Figure 16.1.Area E + H represents
A) the portion of sales tax revenue borne by consumers.
B) the portion of sales tax revenue borne by producers.
C) the excess burden of the sales tax.
D) sales tax revenue collected by the government.
Correct Answer:

Verified
Correct Answer:
Verified
Q30: Rapid economic growth tends to increase the
Q86: What is the tax structure of the
Q88: Figure 16.7 <img src="https://d2lvgg3v3hfg70.cloudfront.net/TB1015/.jpg" alt="Figure 16.7
Q91: Figure 16.1 <img src="https://d2lvgg3v3hfg70.cloudfront.net/TB1015/.jpg" alt="Figure 16.1
Q93: What is the poverty rate?<br>A)the rate at
Q95: For a given supply curve, how does
Q108: An income tax system is _ if
Q185: The Gini coefficient is measured by<br>A)summing up
Q210: A tax bracket is<br>A)the percent of taxable
Q252: Exempting food purchases from sales tax is