Multiple Choice
Figure 16.2 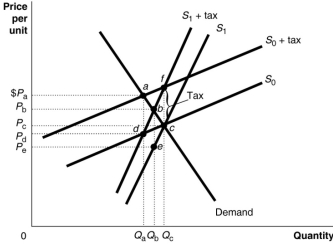 Figure 16.2 shows a demand curve and two sets of supply curves, one set more elastic than the other.
-Refer to Figure 16.2.If the government imposes an excise tax of $1.00 on every unit sold, the consumer's burden of the tax
A) is Pa - Pc under either supply curve.
B) is Pb - Pc under either supply curve.
C) is Pa - Pc if the supply curve is S0 and Pb - Pc if the supply curve is S1.
D) is Pa - Pd if the supply curve is S0 and Pb - Pe if the supply curve is S1.
Correct Answer:

Verified
Correct Answer:
Verified
Q3: Income inequality increases as the Gini coefficient
Q6: There is a difference between who is
Q8: If the government is most interested in
Q9: Figure 16.2 <img src="https://d2lvgg3v3hfg70.cloudfront.net/TB1015/.jpg" alt="Figure 16.2
Q10: How are exemptions and deductions used?<br>A)By taxpayers
Q60: If the marginal tax rate is equal
Q73: The actual division of the burden of
Q98: If the marginal tax rate is greater
Q145: The excess burden of a tax<br>A)measures the
Q229: The term "payroll taxes" is often used