Multiple Choice
Figure 16.2 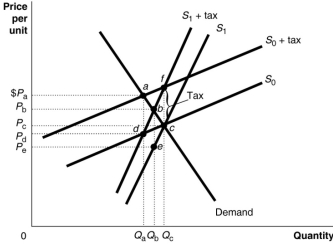 Figure 16.2 shows a demand curve and two sets of supply curves, one set more elastic than the other.
-Refer to Figure 16.2.If the government imposes an excise tax of $1.00 on every unit sold, the producer's burden of the tax
A) is Pa - Pd under either supply curve.
B) is Pb - Pe under either supply curve.
C) is Pa - Pd if the supply curve is S0 and Pb - Pe if the supply curve is S1.
D) is Pc - Pd if the supply curve is S0 and Pc - Pe if the supply curve is S1.
Correct Answer:

Verified
Correct Answer:
Verified
Q66: To what does a personal exemption apply?<br>A)The
Q69: Last year, Anthony Millanti earned exactly $30
Q72: Which of the following is not one
Q73: How does a proportional tax impact people
Q74: Figure 16.1 <img src="https://d2lvgg3v3hfg70.cloudfront.net/TB1015/.jpg" alt="Figure 16.1
Q76: If you pay $2000 in taxes on
Q120: According to the benefits-received principle of taxation<br>A)individuals
Q158: All of the following occur whenever a
Q172: "For a given supply curve, the excess
Q175: In reference to the federal income tax