Multiple Choice
Figure 16.2 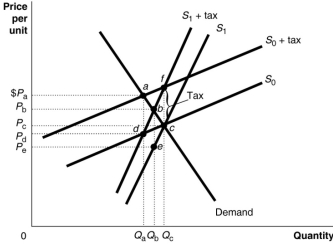 Figure 16.2 shows a demand curve and two sets of supply curves, one set more elastic than the other.
-Refer to Figure 16.2.If the government imposes an excise tax of $1.00 on every unit sold,
A) the deadweight loss is identical under either supply curve.
B) the deadweight loss is greater under the supply curve S1.
C) the deadweight loss is greater under the supply curve S0.
D) there is no deadweight loss since revenue raised is used to fund government projects.
Correct Answer:

Verified
Correct Answer:
Verified
Q15: The horizontal-equity principle of taxation is not
Q60: How does a regressive tax impact people
Q64: The term tax incidence refers to<br>A)the degree
Q66: To what does a personal exemption apply?<br>A)The
Q110: The idea that individuals should be taxed
Q112: Which of the following statements concerning the
Q117: If, as your taxable income decreases, you
Q158: All of the following occur whenever a
Q175: In reference to the federal income tax
Q191: What is the difference between the poverty