Multiple Choice
Figure 16.6 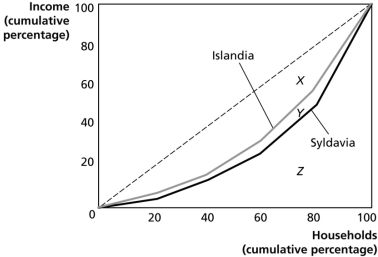 Figure 16.6 shows the Lorenz curves for Islandia and Syldavia.
-Refer to Figure 16.6.If area X = 2060, area Y = 240, and area Z= 2700, calculate the Gini coefficient for Syldavia.
A) 0) 05
B) 0) 12
C) 0) 46
D) 0) 85
Correct Answer:

Verified
Correct Answer:
Verified
Q27: What happens when the demand for a
Q28: Which formula below would a taxpayer use
Q29: Why do economists argue that the corporate
Q32: Which of the following summarises the information
Q35: Figure 16.1 <img src="https://d2lvgg3v3hfg70.cloudfront.net/TB1015/.jpg" alt="Figure 16.1
Q36: If you pay $3000 in taxes on
Q55: Describe the main factors economists believe cause
Q107: According to the benefits-received principle, those who
Q113: The corporate income tax is ultimately paid
Q118: Since lower-income people spend a larger proportion