Multiple Choice
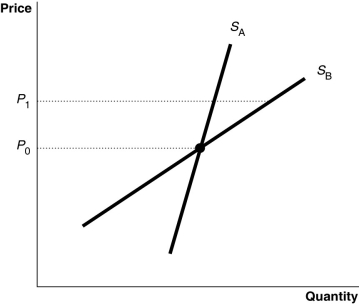
-Refer to Figure 6-12.The diagram shows two supply curves,SA and SB.As price rises from P0 to P1,which supply curve is more elastic?
A) SA
B) SB
C) They are equally inelastic.
D) They are equally elastic.
Correct Answer:

Verified
Correct Answer:
Verified
Q11: At a price of $100, Beachside Canoe
Q44: Table 6-1<br> <img src="https://d2lvgg3v3hfg70.cloudfront.net/TB4193/.jpg" alt="Table 6-1
Q69: Ali's Gyros operates near a college campus.Ali
Q105: When the price of tortilla chips rose
Q107: Since 1950, there has been a substantial
Q247: From 1950 to 2015 the number of
Q274: Between 1950 and 2015, the number of
Q276: Figure 6-1<br> <img src="https://d2lvgg3v3hfg70.cloudfront.net/TB4193/.jpg" alt="Figure 6-1
Q289: The most important determinant of the price
Q290: Total revenue equals<br>A)price per unit times quantity