Multiple Choice
Figure 5-6 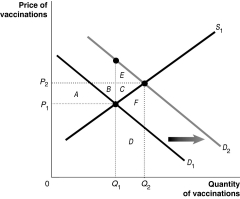 Figure 5-6 shows the market for measles vaccinations, a product whose use generates positive externalities.
-Refer to Figure 5-6. What does D2 represent?
A) the social welfare curve
B) the demand curve reflecting social benefit
C) the demand curve reflecting private benefit
D) the positive externalities curve
Correct Answer:

Verified
Correct Answer:
Verified
Q1: Which of the following describes a positive
Q2: The cost borne by a producer in
Q3: The tragedy of the commons was avoided
Q8: Figure 5-9<br> <img src="https://d2lvgg3v3hfg70.cloudfront.net/TB4193/.jpg" alt="Figure 5-9
Q10: The efficient level of paper production will
Q13: Figure 5-10<br> <img src="https://d2lvgg3v3hfg70.cloudfront.net/TB4192/.jpg" alt="Figure 5-10
Q136: Conceptually, the efficient level of carbon emissions
Q140: Private solutions to the problem of externalities
Q143: When there is a positive externality,<br>A) the
Q223: Because producers do not bear the external