Multiple Choice
Figure 4-1 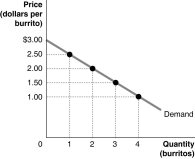 Figure 4-1 shows Arnold's demand curve for burritos.
-Refer to Figure 4-1. If the market price is $1.00, what is Arnold's consumer surplus?
A) $1.00
B) $2.00
C) $6.00
D) $7.00
Correct Answer:

Verified
Correct Answer:
Verified
Q25: Consumer surplus in a market for a
Q32: The following equations represent the demand and
Q56: Figure 4-1<br> <img src="https://d2lvgg3v3hfg70.cloudfront.net/TB4193/.jpg" alt="Figure 4-1
Q91: Table 4-7<br> <img src="https://d2lvgg3v3hfg70.cloudfront.net/TB4188/.jpg" alt="Table 4-7
Q97: The cities of Francistown and Nalady are
Q121: Table 4-2<br> <img src="https://d2lvgg3v3hfg70.cloudfront.net/TB4193/.jpg" alt="Table 4-2
Q145: Is there a difference between the "true
Q146: <img src="https://d2lvgg3v3hfg70.cloudfront.net/TB3018/.jpg" alt=" Figure 4-8 shows
Q150: Which of the following describes the difference
Q157: Table 4-7<br> <img src="https://d2lvgg3v3hfg70.cloudfront.net/TB7397/.jpg" alt="Table 4-7