Multiple Choice
Figure 4-6 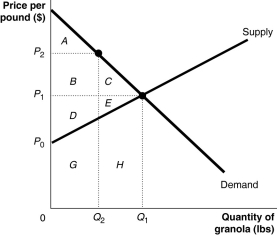 Figure 4-6 shows the market for granola. The market is initially in equilibrium at a price of P1 and a quantity of Q1. Now suppose producers decide to cut output to Q2 in order to raise the price to P2.
-Refer to Figure 4-6. At the equilibrium price of P1, consumers are willing to buy the Q1 pounds of granola. Is this an economically efficient quantity?
A) No, the marginal benefit of the last unit (Q1) exceeds the marginal cost of that last unit.
B) Yes, because marginal cost is zero at the price of P1.
C) Yes, because P1 is the price where marginal benefit equals marginal cost.
D) No, the marginal cost of the last unit (Q1) exceeds the marginal benefit of the last unit.
Correct Answer:

Verified
Correct Answer:
Verified
Q21: Figure 4-3 <img src="https://d2lvgg3v3hfg70.cloudfront.net/TB7397/.jpg" alt="Figure 4-3
Q27: Table 4-11<br> <img src="https://d2lvgg3v3hfg70.cloudfront.net/TB7397/.jpg" alt="Table 4-11
Q36: The difference between consumer surplus and producer
Q64: Which of the following statements is true?<br>A)Consumer
Q73: Rent control is an example of a
Q108: Consumer surplus is the difference between the
Q139: Table 4-8<br> <img src="https://d2lvgg3v3hfg70.cloudfront.net/TB7397/.jpg" alt="Table 4-8
Q208: Suppose the demand curve for a product
Q239: <img src="https://d2lvgg3v3hfg70.cloudfront.net/TB3018/.jpg" alt=" Figure 4-10 shows
Q343: Table 4-11<br> <img src="https://d2lvgg3v3hfg70.cloudfront.net/TB7397/.jpg" alt="Table 4-11