Essay
Figure 4-21 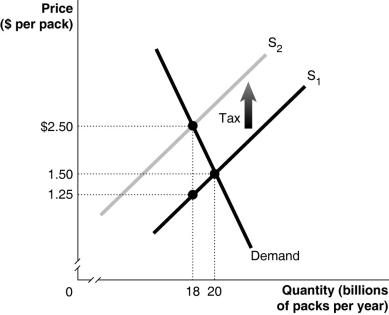
-Refer to Figure 4-21. The figure above represents demand and supply in the market for cigarettes. Use the diagram to answer the following questions.
a. How much is the government tax on each pack of cigarettes?
b. What portion of the unit tax is paid by consumers?
c. What portion of the unit tax is paid by producers?
d. What is the quantity sold after the imposition of the tax?
e. What is the after-tax revenue per pack received by producers?
f. What is the total tax revenue collected by the government?
g. What is the value of the excess burden of the tax?
h. Is this cigarette tax efficient?
Correct Answer:

Verified
a. $1.25
b. Consumer burden = $1.00
c. P...View Answer
Unlock this answer now
Get Access to more Verified Answers free of charge
Correct Answer:
Verified
b. Consumer burden = $1.00
c. P...
View Answer
Unlock this answer now
Get Access to more Verified Answers free of charge
Q13: Increases in the minimum wage are intended
Q33: Economists are reluctant to state that price
Q80: Suppose the demand curve for a product
Q109: Marginal benefit is equal to the _
Q123: To affect the market outcome, a price
Q208: Figure 4-4 <img src="https://d2lvgg3v3hfg70.cloudfront.net/TB7397/.jpg" alt="Figure 4-4
Q209: Figure 4-3 <img src="https://d2lvgg3v3hfg70.cloudfront.net/TB7397/.jpg" alt="Figure 4-3
Q213: Table 4-8<br> <img src="https://d2lvgg3v3hfg70.cloudfront.net/TB7397/.jpg" alt="Table 4-8
Q214: Table 4-6<br> <img src="https://d2lvgg3v3hfg70.cloudfront.net/TB7397/.jpg" alt="Table 4-6
Q216: Figure 4-8 <img src="https://d2lvgg3v3hfg70.cloudfront.net/TB7397/.jpg" alt="Figure 4-8