Multiple Choice
Figure 30-1 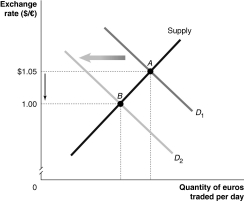
-Refer to Figure 30-1. Which of the following would cause the change depicted in the figure above?
A) U.S. productivity falls relative to European productivity.
B) Americans increase their preferences for goods produced in the EU relative to American goods.
C) The European Union increases its quotas on Italian wine.
D) The price level of goods produced in the EU decreases relative to the price level of goods produced in the United States.
Correct Answer:

Verified
Correct Answer:
Verified
Q23: Increasing a fixed exchange rate is called
Q89: The three most important international financial centers
Q123: If currencies around the world are based
Q136: If the implied exchange rate between Big
Q146: Before 1980,U.S.investors rarely invested in foreign capital
Q169: When the value of a currency is
Q179: An easy way to determine if a
Q186: Before 1980,most U.S.corporations raised funds<br>A)in U.S.and foreign
Q240: If the U.S.government places tariffs on imports
Q248: You decide to work in London for