Multiple Choice
Figure 3-2 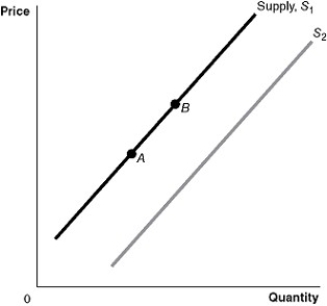
-Refer to Figure 3-2.An increase in the number of firms in the market would be represented by a movement from
A) A to B.
B) B to A.
C) S1 to S2.
D) S2 to S1.
Correct Answer:

Verified
Correct Answer:
Verified
Related Questions
Q9: According to a recent study,"Stricter college alcohol
Q18: Which of the following would cause a
Q24: Which of the following would cause both
Q42: At a product's equilibrium price<br>A)the product's demand
Q45: Figure 3-2 <img src="https://d2lvgg3v3hfg70.cloudfront.net/TB3018/.jpg" alt="Figure 3-2
Q82: What is the difference between an "increase
Q87: If the price of music downloads was
Q88: A(n)_ is represented by a leftward shift
Q198: A decrease in the price of GPS
Q219: Suppose that when the price of oranges