Multiple Choice
Figure 3-2 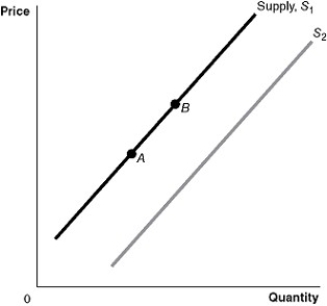
-Refer to Figure 3-2.A decrease in productivity would be represented by a movement from
A) A to B.
B) B to A.
C) S1 to S2.
D) S2 to S1.
Correct Answer:

Verified
Correct Answer:
Verified
Related Questions
Q87: A change in which variable will change
Q98: Explain the difference between a normal good
Q111: Indicate whether each of the following situations
Q128: Cole was discussing the market for cocoa
Q134: In September,buyers of silver expect that the
Q164: Figure 3-7 <img src="https://d2lvgg3v3hfg70.cloudfront.net/TB1236/.jpg" alt="Figure 3-7
Q167: A decrease in the demand for incandescent
Q168: "The price of digital cameras fell because
Q210: Table 3-4<br> <img src="https://d2lvgg3v3hfg70.cloudfront.net/TB7397/.jpg" alt="Table 3-4
Q240: If the price of gasoline decreases, what