Multiple Choice
Figure 3-3 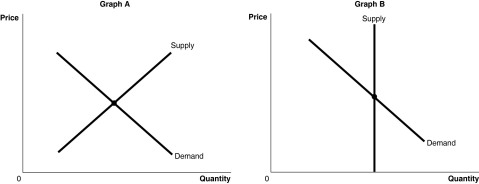
-Refer to Figure 3-3. The figure above shows the supply and demand curves for two markets: the market for original Picasso paintings and the market for designer jeans. Which graph most likely represents which market?
A) Graph B represents the market for original Picasso paintings and Graph A represents the market for designer jeans.
B) Graph A represents the market for original Picasso paintings and Graph B represents the market for designer jeans.
C) Graph A represents both the market for original Picasso paintings and designer jeans.
D) Graph B represents both the market for original Picasso paintings and designer jeans.
Correct Answer:

Verified
Correct Answer:
Verified
Q18: Which of the following would cause a
Q91: Hurricane Katrina damaged a large portion of
Q105: Cigars are becoming increasingly popular in the
Q108: Consider the collectors' market for first editions
Q124: Studies have shown that smoking cigarettes can
Q129: Figure 3-8 <img src="https://d2lvgg3v3hfg70.cloudfront.net/TB3018/.jpg" alt="Figure 3-8
Q146: What is the ceteris paribus condition?
Q153: The income effect of a price change
Q168: If you are considering buying either an
Q202: Figure 3-7 <img src="https://d2lvgg3v3hfg70.cloudfront.net/TB1236/.jpg" alt="Figure 3-7