Multiple Choice
Figure 3-7 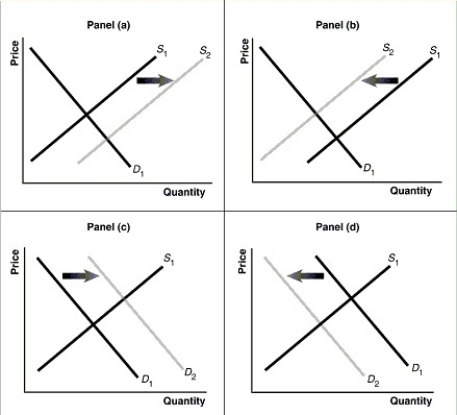
-Refer to Figure 3-7. Assume that the graphs in this figure represent the demand and supply curves for potatoes and that steak and potatoes are complements. Which panel describes what happens in this market when the price of steak rises?
A) Panel (a)
B) Panel (b)
C) Panel (c)
D) Panel (d)
Correct Answer:

Verified
Correct Answer:
Verified
Q62: If the demand for a product increases
Q77: Figure 3-4<br> <img src="https://d2lvgg3v3hfg70.cloudfront.net/TB4193/.jpg" alt="Figure 3-4
Q126: If an increase in income leads to
Q150: Figure 3-5 <img src="https://d2lvgg3v3hfg70.cloudfront.net/TB4189/.jpg" alt="Figure 3-5
Q154: Which of the following will shift the
Q163: If the price of a product is
Q210: Table 3-4<br> <img src="https://d2lvgg3v3hfg70.cloudfront.net/TB7397/.jpg" alt="Table 3-4
Q210: Figure 3-7 <img src="https://d2lvgg3v3hfg70.cloudfront.net/TB1236/.jpg" alt="Figure 3-7
Q454: Figure 3-8 <img src="https://d2lvgg3v3hfg70.cloudfront.net/TB4188/.jpg" alt="Figure 3-8
Q459: An increase in the equilibrium quantity of