Multiple Choice
Figure 3-7 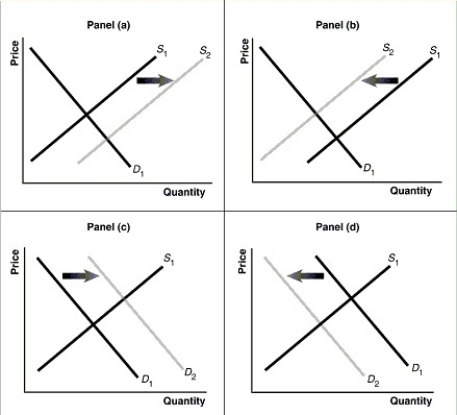
-Refer to Figure 3-7. Assume that the graphs in this figure represent the demand and supply curves for mustard and that bratwurst and mustard are complements. Which panel describes what happens in this market when the price of bratwurst falls?
A) Panel (a)
B) Panel (b)
C) Panel (c)
D) Panel (d)
Correct Answer:

Verified
Correct Answer:
Verified
Q15: Which of the following would cause the
Q19: An increase in quantity supplied is represented
Q80: Figure 3-1 <img src="https://d2lvgg3v3hfg70.cloudfront.net/TB3018/.jpg" alt="Figure 3-1
Q105: If the population increases and input prices
Q111: Indicate whether each of the following situations
Q132: If the United States placed an embargo
Q136: Select the phrase that correctly completes the
Q158: Figure 3-7<br> <img src="https://d2lvgg3v3hfg70.cloudfront.net/TB4193/.jpg" alt="Figure 3-7
Q383: Which of the following has occurred as
Q389: In recent years the cost of producing