Multiple Choice
Figure 3-8 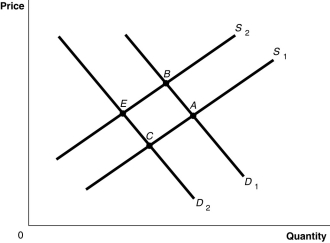
-Refer to Figure 3-8. The graph in this figure illustrates an initial competitive equilibrium in the market for apples at the intersection of D2 and S2 (point
A) A positive change in the technology used to produce apples and decrease in the price of oranges, a substitute for apples.
B) An increase in the wages of apple workers and a decrease in the price of oranges, a substitute for apples.
C) An increase in the number of apple producers and a decrease in the number of apple trees as a result of disease.
D) A decrease in the wages of apple workers and an increase in the price of oranges, a substitute for apples.
E) . Which of the following changes would cause the equilibrium to change to point A?
Correct Answer:

Verified
Correct Answer:
Verified
Q35: The law of demand implies, holding everything
Q77: Figure 3-4<br> <img src="https://d2lvgg3v3hfg70.cloudfront.net/TB4193/.jpg" alt="Figure 3-4
Q87: Figure 3-1 <img src="https://d2lvgg3v3hfg70.cloudfront.net/TB3018/.jpg" alt="Figure 3-1
Q115: Let D = demand,S = supply,P =
Q124: Figure 3-2 <img src="https://d2lvgg3v3hfg70.cloudfront.net/TB3018/.jpg" alt="Figure 3-2
Q126: If an increase in income leads to
Q150: Figure 3-5 <img src="https://d2lvgg3v3hfg70.cloudfront.net/TB4189/.jpg" alt="Figure 3-5
Q210: Table 3-4<br> <img src="https://d2lvgg3v3hfg70.cloudfront.net/TB7397/.jpg" alt="Table 3-4
Q215: Prices of smartphones (assume that this is
Q372: Figure 3-8 <img src="https://d2lvgg3v3hfg70.cloudfront.net/TB3018/.jpg" alt="Figure 3-8