Multiple Choice
Figure 3-8 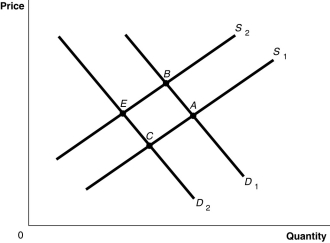
-Refer to Figure 3-8. The graph in this figure illustrates an initial competitive equilibrium in the market for apples at the intersection of D2 and S1 (point
A) A positive change in the technology used to produce apples and decrease in the price of oranges, a substitute for apples.
B) An increase in the wages of apple workers and an increase in the price of oranges, a substitute for apples.
C) An increase in the number of apple producers and a decrease in the number of apple trees as a result of disease.
C) . Which of the following changes would cause the equilibrium to change to point B?
D) A decrease in the wages of apple workers and an increase in the price of oranges, a substitute for apples.
Correct Answer:

Verified
Correct Answer:
Verified
Q48: Quantity supplied refers to the amount of
Q59: When deciding on which new products to
Q115: If the price of prime rib falls,the
Q138: For each of the following pairs of
Q149: Which of the following would shift the
Q159: Figure 3-5<br> <img src="https://d2lvgg3v3hfg70.cloudfront.net/TB4193/.jpg" alt="Figure 3-5
Q177: Which of the following would cause a
Q180: If the price of train tickets decreases,what
Q204: Discuss the correct and incorrect economic analysis
Q207: The income effect explains why there is