Multiple Choice
Figure 3-8 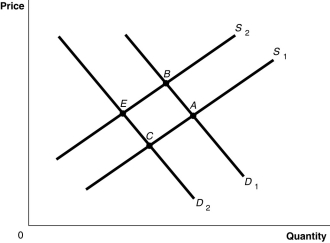
-Refer to Figure 3-8. The graph in this figure illustrates an initial competitive equilibrium in the market for apples at the intersection of D1 and S2 (point
A) A positive change in the technology used to produce apples and decrease in the price of oranges, a substitute for apples.
B) An increase in the wages of apple workers and an increase in the price of oranges, a substitute for apples.
B) . Which of the following changes would cause the equilibrium to change to point C?
C) An increase in the number of apple producers and a decrease in the number of apple trees as a result of disease.
D) A decrease in the wages of apple workers and an increase in the price of oranges, a substitute for apples.
Correct Answer:

Verified
Correct Answer:
Verified
Q42: If in the market for apples the
Q43: Farmers can plant either corn or soybeans
Q64: The _ effect of a price change
Q109: Draw a demand curve and label it
Q119: Figure 3-4<br> <img src="https://d2lvgg3v3hfg70.cloudfront.net/TB4193/.jpg" alt="Figure 3-4
Q164: Digital video recorders (DVRs) were introduced to
Q167: If the price of pork rinds falls,the
Q168: Figure 3-6 <img src="https://d2lvgg3v3hfg70.cloudfront.net/TB4188/.jpg" alt="Figure 3-6
Q171: What are the five most important variables
Q223: Holding everything else constant, a decrease in