Multiple Choice
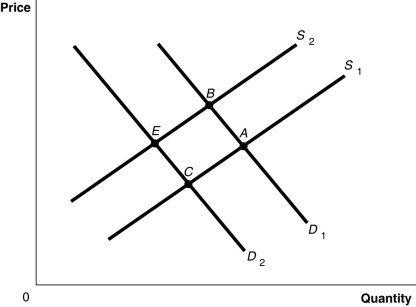
Figure 3-8 
-Refer to Figure 3-8.The graph in this figure illustrates an initial competitive equilibrium in the market for apples at the intersection of D1 and S1 (point A) .If there is an increase in the wages of apple workers and an increase in the price of oranges,a substitute for apples,the equilibrium could move to which point?
A) none of the points shown
B) B
C) C
D) E
Correct Answer:

Verified
Correct Answer:
Verified
Q24: Auctions in recent years have resulted in
Q31: A decrease in input costs in the
Q41: Which of the following is evidence of
Q57: Prices of microbrewery beer (assume that this
Q103: In recent years, the cost of producing
Q114: Draw a supply and demand graph showing
Q119: For each of the following pairs of
Q130: If more insurance companies decide to cover
Q162: A movement along the demand curve for
Q423: Table 3-3<br> <img src="https://d2lvgg3v3hfg70.cloudfront.net/TB7397/.jpg" alt="Table 3-3