Multiple Choice
Figure 3-8 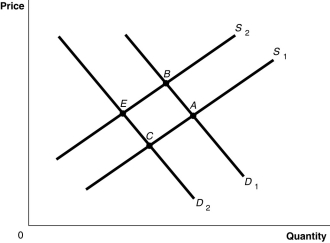
-Refer to Figure 3-8. The graph in this figure illustrates an initial competitive equilibrium in the market for motorcycles at the intersection of D1 and S2 (point
A) A
B) B
B) . f there is an increase in number of companies producing motorcycles and a decrease in income (assume motorcycles are a normal good) , the equilibrium could move to which point?
C) C
D) E
Correct Answer:

Verified
Correct Answer:
Verified
Q10: If a decrease in income leads to
Q20: A change in which variable will change
Q74: If the price of orchids falls, the
Q79: Use the following demand schedule for apples
Q82: Article Summary<br>A growing number of U.S. citizens
Q144: How does the decreasing use of traditional
Q145: A change in supply is represented by
Q147: Scarcity is defined as the situation that
Q156: Last month,the Tecumseh Corporation supplied 400 units
Q232: Which of the following would cause both