Multiple Choice
Figure 26-10 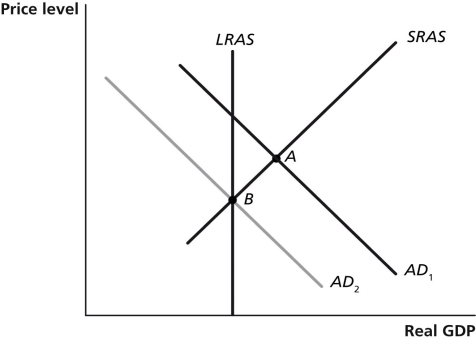
-Refer to Figure 26-10. In the figure above, suppose the economy is initially at point A. The movement of the economy to point B as shown in the graph illustrates the effect of which of the following policy actions by the Federal Reserve?
A) an increase in income taxes
B) a decrease in the required reserve ratio
C) an open market purchase of Treasury bills
D) an open market sale of Treasury bills
Correct Answer:

Verified
Correct Answer:
Verified
Q19: In 2017,some banks in Europe had to
Q20: If the probability of losing your job
Q29: Your income will increase if the Federal
Q61: Which of the following would cause the
Q65: Inflation targeting allows monetary policy to focus
Q97: Suppose that households became mistrustful of the
Q193: Figure 26-7 <img src="https://d2lvgg3v3hfg70.cloudfront.net/TB7397/.jpg" alt="Figure 26-7
Q194: Figure 26-11 <img src="https://d2lvgg3v3hfg70.cloudfront.net/TB7397/.jpg" alt="Figure 26-11
Q196: By the 2000s,an important market change occurred
Q266: The money supply curve is vertical if<br>A)banks