Multiple Choice
Figure 24-3 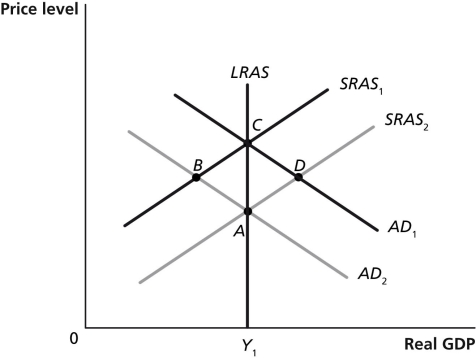
-Refer to Figure 24-3. Which of the points in the above graph are possible long-run equilibria?
A) A and B
B) A and C
C) A and D
D) B and D
Correct Answer:

Verified
Correct Answer:
Verified
Q56: Which of the following will shift the
Q94: If workers and firms have rational expectations,they
Q167: The recession of 2007-2009 began in _,with
Q219: Which of the following best describes the
Q236: Deflation will<br>A)increase aggregate demand.<br>B)increase the quantity of
Q259: Studies have shown that<br>A)firms often cut nominal
Q265: Figure 24-1 <img src="https://d2lvgg3v3hfg70.cloudfront.net/TB7397/.jpg" alt="Figure 24-1
Q271: Figure 24-2 <img src="https://d2lvgg3v3hfg70.cloudfront.net/TB7397/.jpg" alt="Figure 24-2
Q274: Figure 24-4 <img src="https://d2lvgg3v3hfg70.cloudfront.net/TB7397/.jpg" alt="Figure 24-4
Q280: Briefly describe monetarism and the monetary growth