Multiple Choice
Figure 24-4 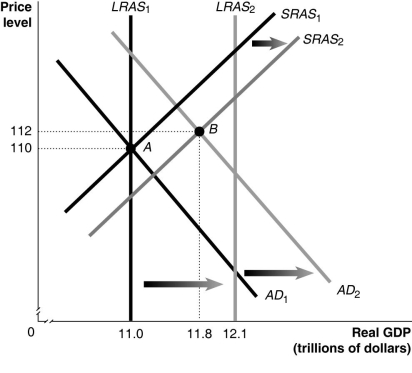
-Refer to Figure 24-4.In the figure above,LRAS1 and SRAS1 denote LRAS and SRAS in year 1,while LRAS2 and SRAS2 denote LRAS and SRAS in year 2.Given the economy is at point A in year 1,what is the growth rate in potential GDP in year 2?
A) 8%
B) 9.1%
C) 10%
D) 12%
Correct Answer:

Verified
Correct Answer:
Verified
Q20: An increase in the price level will<br>A)shift
Q77: At the beginning of the recession of
Q91: Figure 24-2 <img src="https://d2lvgg3v3hfg70.cloudfront.net/TB3018/.jpg" alt="Figure 24-2
Q94: Figure 24-2 <img src="https://d2lvgg3v3hfg70.cloudfront.net/TB3018/.jpg" alt="Figure 24-2
Q119: The long-run aggregate supply curve is vertical.
Q137: The long-run adjustment to a negative supply
Q140: The dynamic aggregate demand and aggregate supply
Q146: Inflation is generally the result of total
Q194: The process of an economy adjusting from
Q280: Briefly describe monetarism and the monetary growth