Multiple Choice
Figure 24-4 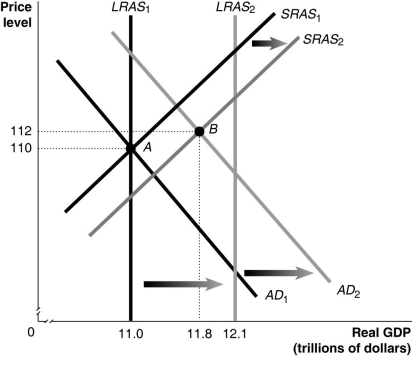
-Refer to Figure 24-4. Given the economy is at point A in year 1, what will happen to the unemployment rate in year 2?
A) It will rise.
B) It will fall.
C) It will remain constant.
D) not enough information to answer the question
Correct Answer:

Verified
Correct Answer:
Verified
Q1: Explain why the long-run aggregate supply curve
Q56: Which of the following will shift the
Q74: The real business cycle model focuses on
Q167: The recession of 2007-2009 began in _,with
Q219: Which of the following best describes the
Q259: Studies have shown that<br>A)firms often cut nominal
Q270: Figure 24-3 <img src="https://d2lvgg3v3hfg70.cloudfront.net/TB7397/.jpg" alt="Figure 24-3
Q271: Figure 24-2 <img src="https://d2lvgg3v3hfg70.cloudfront.net/TB7397/.jpg" alt="Figure 24-2
Q276: Article Summary<br>For reasons including overproduction in the
Q278: Figure 24-2 <img src="https://d2lvgg3v3hfg70.cloudfront.net/TB7397/.jpg" alt="Figure 24-2