Multiple Choice
Table 20-8
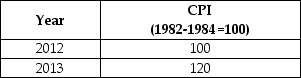
-Refer to Table 20-8. Suppose that the data in the table above reflect the price levels in the economy. What is the inflation rate in between 2012 and 2013?
A) 2%
B) 5%
C) 10%
D) 12%
E) 20%
Correct Answer:

Verified
Correct Answer:
Verified
Q23: Table 20-10<br> <img src="https://d2lvgg3v3hfg70.cloudfront.net/TB4188/.jpg" alt="Table 20-10
Q67: Discuss the likely impact of each of
Q97: The Bureau of Labor Statistics would categorize
Q150: Eliminating frictional unemployment would be good for
Q153: During a deflationary period<br>A)the nominal interest rate
Q212: If inflation is anticipated,some effects of inflation
Q230: What are some reasons why the unemployment
Q235: What does the PPI measure?<br>A)the average change
Q239: If the price level rose in three
Q243: The cost to firms of changing prices<br>A)is