Multiple Choice
Table 20-19
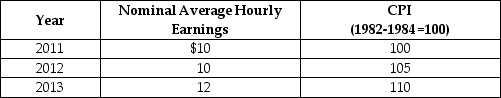
-Refer to Table 20-19. Looking at the table above, what is the approximate rate of growth of real average hourly earnings from 2011 to 2012?
A) 15%
B) 4.4%
C) -1.5%
D) -4.8%
Correct Answer:

Verified
Correct Answer:
Verified
Related Questions
Q3: Explain what economists mean by full employment
Q54: What effect does the payment of government
Q76: Establishing a state employment agency that speeds
Q106: Jack just told his boss that he
Q112: Structural unemployment is the result of<br>A)a persistent
Q127: What is outlet bias?<br>A)the tendency for households
Q174: If inflation is higher than expected,this helps
Q216: Most of the unemployment that occurred during
Q237: Due to slowing growth in China and
Q260: Jack just received a promotion at work