Multiple Choice
Table 20-19
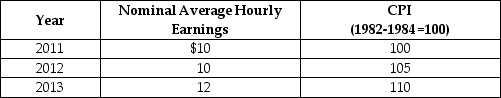
-Refer to Table 20-19. Looking at the table above, what is the rate of growth of the average price level from 2012 to 2013?
A) 1%
B) 2%
C) 3.5%
D) 4.76%
E) 5.25%
Correct Answer:

Verified
Correct Answer:
Verified
Related Questions
Q8: Counting part-time workers who are looking for
Q34: The average period of unemployment was _
Q60: What is the difference between the nominal
Q109: The reasons why someone cannot get a
Q114: If an economy experiences deflation,the real interest
Q160: The nominal interest rate equals the real
Q163: Describe how a lender can lose during
Q200: Minimum wage laws cause unemployment because the
Q210: If cyclical unemployment is eliminated in the
Q281: Which of the following labor market statistics