Multiple Choice
Figure 2-16 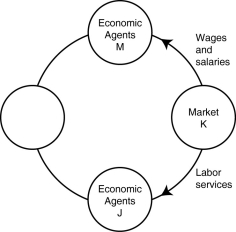
-Refer to Figure 2-16. In the circular flow diagram, market K represents
A) households.
B) product markets.
C) firms.
D) factor markets.
Correct Answer:

Verified
Correct Answer:
Verified
Q32: Table 2-17<br> <img src="https://d2lvgg3v3hfg70.cloudfront.net/TB7397/.jpg" alt="Table 2-17
Q34: Table 2-16<br> <img src="https://d2lvgg3v3hfg70.cloudfront.net/TB7397/.jpg" alt="Table 2-16
Q51: A worker is hired in a<br>A)goods and
Q71: What does the term "increasing marginal opportunity
Q133: Households<br>A) have no influence on the circular
Q140: Table 2-14<br> <img src="https://d2lvgg3v3hfg70.cloudfront.net/TB4188/.jpg" alt="Table 2-14
Q161: If a country produces only two goods,
Q184: Define the term "property rights." Explain why
Q196: For a person to have a comparative
Q201: If the production possibilities frontier is _,