Multiple Choice
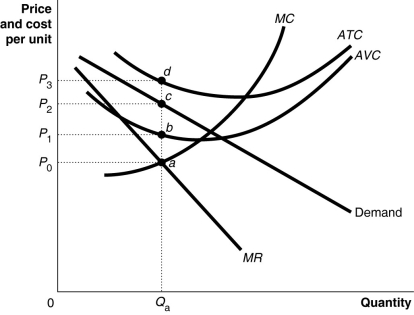 Figure 13-4 shows short-run cost and demand curves for a monopolistically competitive firm in the market for designer watches.
-Refer to Figure 13-4.What is the area that represents the loss made by the firm?
A) the area P0adP3
B) the area P1bcP2
C) the area P0acP2
D) the area P2cdP3
Correct Answer:

Verified
Correct Answer:
Verified
Q29: Which of the following describes a difference
Q41: Tony's Italian Ice is a monopolistically competitive
Q66: Which of the following is not a
Q69: What is the difference between the terms
Q123: Consumers benefit from monopolistic competition by<br>A)being able
Q161: Assume price exceeds average variable cost over
Q168: <img src="https://d2lvgg3v3hfg70.cloudfront.net/TB3018/.jpg" alt=" Figure 13-4 shows
Q254: A monopolistically competitive firm maximizes profit in
Q259: Economists have long debated whether there is
Q260: Which of the following is true for