Multiple Choice
Figure 13-8
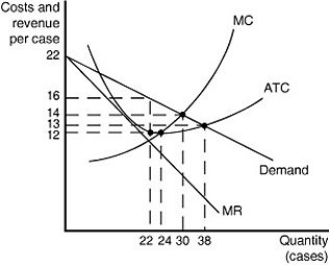
Figure 13-8 shows cost and demand curves for a monopolistically competitive producer of iced tea.
-Refer to Figure 13-8.Based on the diagram, one can conclude that
A) some existing firms will exit the market.
B) new firms will enter the market.
C) the industry is in long-run equilibrium.
D) firms achieve productive efficiency.
Correct Answer:

Verified
Correct Answer:
Verified
Q75: Table 13-4<br> <img src="https://d2lvgg3v3hfg70.cloudfront.net/TB4193/.jpg" alt="Table 13-4
Q76: Table 13-3<br> <img src="https://d2lvgg3v3hfg70.cloudfront.net/TB4193/.jpg" alt="Table 13-3
Q77: In the United States, the average person
Q78: A monopolistically competitive firm chooses<br>A)both the quantity
Q79: What effect does the entry of new
Q81: New firms are able to enter monopolistically
Q82: One way by which firms differentiate their
Q83: The profit-maximizing rule for a monopolistically competitive
Q84: A monopolistically competitive firm faces a downward-sloping
Q85: Figure 13-11<br> <img src="https://d2lvgg3v3hfg70.cloudfront.net/TB4193/.jpg" alt="Figure 13-11