Essay
Figure 13-10
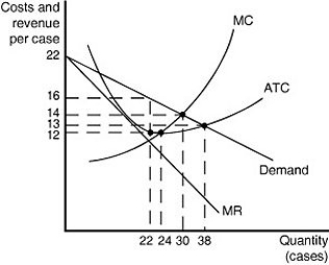
Figure 13-10 shows cost and demand curves for a monopolistically competitive producer of iced tea.
-Refer to Figure 13-10.to answer the following questions.
a.What is the profit-maximizing output level?
b.What is the profit-maximizing price?
c.At the profit-maximizing output level, how much profit will be realized?
d.Does this graph most likely represent the long run or the short run? Why?
Correct Answer:

Verified
a.The profit-maximizing output...View Answer
Unlock this answer now
Get Access to more Verified Answers free of charge
Correct Answer:
Verified
View Answer
Unlock this answer now
Get Access to more Verified Answers free of charge
Q48: Figure 13-19<br> <img src="https://d2lvgg3v3hfg70.cloudfront.net/TB4193/.jpg" alt="Figure 13-19
Q49: In 2011, Red Robin announced that it
Q50: When a monopolistically competitive firm lowers its
Q51: If Panera Bread's "clean food" strategy succeeds
Q52: Figure 13-17<br> <img src="https://d2lvgg3v3hfg70.cloudfront.net/TB4193/.jpg" alt="Figure 13-17
Q54: How does the long-run equilibrium of a
Q55: Most economists believe that consumers would be
Q56: Which of the following would not occur
Q57: The marginal revenue of a monopolistically competitive
Q58: Figure 13-3<br> <img src="https://d2lvgg3v3hfg70.cloudfront.net/TB4193/.jpg" alt="Figure 13-3