Multiple Choice
Figure 11-12
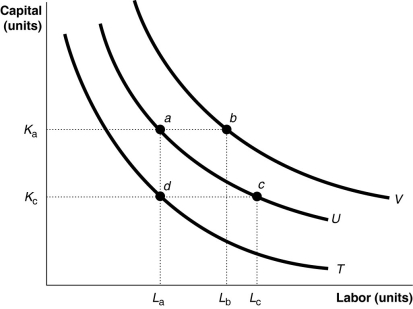
-Refer to Figure 11-12.Which of the following statements about the input combinations shown in the diagram is false?
A) The firm produces a higher output level when it uses input combination b compared to input combination a.
B) The firm produces a lower output level when it uses input combination d compared to input combination a.
C) The firm produces the same output level when it uses input combination a or c.
D) The firm incurs the same total cost when it uses input combination a or c to produce a given quantity of output.
Correct Answer:

Verified
Correct Answer:
Verified
Q96: In the short run, if average product
Q97: Higher isocost lines correspond to higher<br>A)profits.<br>B)total costs
Q98: If a firm decreases its plant size
Q99: What is the difference between total cost
Q100: Implicit costs can be defined as<br>A)accounting profit
Q102: Marginal cost is calculated for a particular
Q103: Figure 11-18<br> <img src="https://d2lvgg3v3hfg70.cloudfront.net/TB4193/.jpg" alt="Figure 11-18
Q104: If production displays economies of scale, the
Q105: An isoquant shows<br>A)the combinations of two goods
Q106: Figure 11-1<br> <img src="https://d2lvgg3v3hfg70.cloudfront.net/TB4193/.jpg" alt="Figure 11-1