menu-iconExamlexExamLexServices

Discover

Ask a Question
  1. All Topics
  2. Topic
    Business
  3. Study Set
    Economics Study Set 3
  4. Exam
    Exam 1: Economics: Foundations and Models
  5. Question
    Figure 1-1 -Refer to Figure 1-1. Using the Information in the Figure
Solved

Figure 1-1 -Refer to Figure 1-1. Using the Information in the Figure

Question 46

Question 46

Multiple Choice

Figure 1-1 Figure 1-1   -Refer to Figure 1-1. Using the information in the figure above, calculate the percentage change in sales of alcoholic beverages between 2008 and 2011. A)  23.1% B)  23.8% C)  30% D)  42.9%
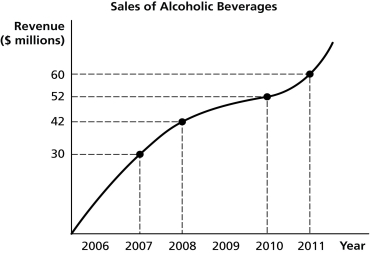
-Refer to Figure 1-1. Using the information in the figure above, calculate the percentage change in sales of alcoholic beverages between 2008 and 2011.


A) 23.1%
B) 23.8%
C) 30%
D) 42.9%

Correct Answer:

verifed

Verified

Unlock this answer now
Get Access to more Verified Answers free of charge

Related Questions

Q18: What is a marginal benefit?

Q41: Lionel's Lawn Care is a company that

Q43: Table 1-2<br> <img src="https://d2lvgg3v3hfg70.cloudfront.net/TB4188/.jpg" alt="Table 1-2

Q44: Scenario 1-2<br>Suppose a hat manufacturer currently sells

Q107: One example of human capital is the

Q116: The cost incurred from the production of

Q140: Every society faces trade-offs.Explain the concept of

Q143: Which of the following are positive economic

Q147: Voluntary exchange increases economic efficiency<br>A)because neither the

Q205: One desirable outcome of a market economy

Examlex

ExamLex

About UsContact UsPerks CenterHomeschoolingTest Prep

Work With Us

Campus RepresentativeInfluencers

Links

FaqPricingChrome Extension

Download The App

Get App StoreGet Google Play

Policies

Privacy PolicyTerms of ServiceHonor CodeCommunity Guidelines

Scan To Download

qr-code

Copyright © (2025) ExamLex LLC.

Privacy PolicyTerms Of ServiceHonor CodeCommunity Guidelines