Multiple Choice
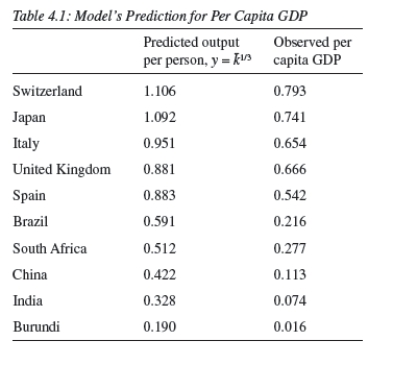
-One explanation for the difference between the predicted output per person and the observed per capita GDP in Table 4.1 is:
A) differences in the labor supply.
B) differences in human capital.
C) differences in per capita capital.
D) differences in capital's share of GDP.
E) none of the above
Correct Answer:

Verified
Correct Answer:
Verified
Q23: Institutions are one example of factors that
Q50: If the production function is given by
Q51: In the Cobb-Douglas production function <img src="https://d2lvgg3v3hfg70.cloudfront.net/TB4305/.jpg"
Q52: If <img src="https://d2lvgg3v3hfg70.cloudfront.net/TB4305/.jpg" alt="If And
Q54: In the equation <img src="https://d2lvgg3v3hfg70.cloudfront.net/TB4305/.jpg" alt="In the
Q56: As a measure for total factor productivity,we
Q57: In the production function <img src="https://d2lvgg3v3hfg70.cloudfront.net/TB4305/.jpg" alt="In
Q58: Convert the Cobb-Douglas production <img src="https://d2lvgg3v3hfg70.cloudfront.net/TB4305/.jpg" alt="Convert
Q60: In the poorest countries in the world,the
Q83: Mathematically, an economic model is:<br>A) a fake