Multiple Choice
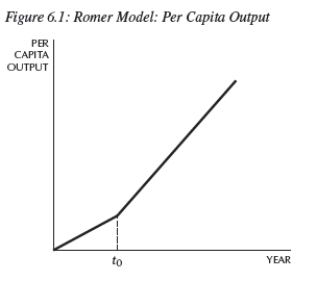
-In the Romer model in Figure 6.1,at time t0,a change in the growth rate of per capita output can be explained by:
A) an increase in the ideas efficiency parameter.
B) an increase in the population.
C) an increase in the research share.
D) an increase in the saving rate.
E) a and b
Correct Answer:

Verified
Correct Answer:
Verified
Q17: The production function <img src="https://d2lvgg3v3hfg70.cloudfront.net/TB4305/.jpg" alt="The production
Q19: If there are large fixed costs,due to
Q20: With the production function <img src="https://d2lvgg3v3hfg70.cloudfront.net/TB4305/.jpg" alt="With
Q21: To get increasing returns to scale using
Q25: If there are large fixed or research
Q26: Suppose the Romer model parameters in East
Q27: In the Romer model,the growth rate of
Q44: New irrigation techniques are examples of ideas.
Q61: According to the combined Solow-Romer model, all
Q113: In the Romer model, with decreasing returns