Multiple Choice
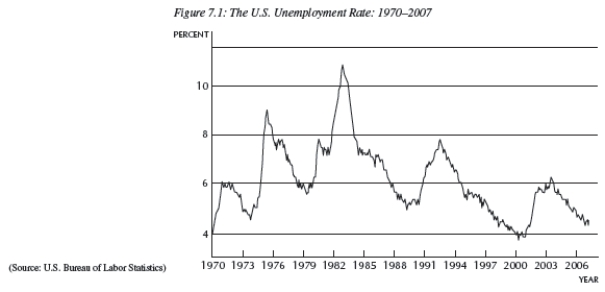
-Using Figure 7.1,which depicts the U.S.unemployment rate,identify the year(s) of the peak of the boom.
A) 1983
B) 1989
C) 2001
D) all of the above
E) none of the above
Correct Answer:

Verified
Correct Answer:
Verified
Q2: Frictional unemployment is the unemployment that results
Q5: Unemployment benefits in the United States are
Q7: The equation means you: <img src="https://d2lvgg3v3hfg70.cloudfront.net/TB4305/.jpg" alt="The
Q8: <img src="https://d2lvgg3v3hfg70.cloudfront.net/TB4305/.jpg" alt=" -Consider Figure 7.4.Given
Q9: You are a senior graduating soon.In 2010
Q12: The supply of labor curve slopes upward
Q42: The natural rate of unemployment is equal
Q51: The rise in the employment-population ratio largely
Q58: The "natural rate of unemployment" is the
Q80: The natural rate of unemployment is equal