Multiple Choice
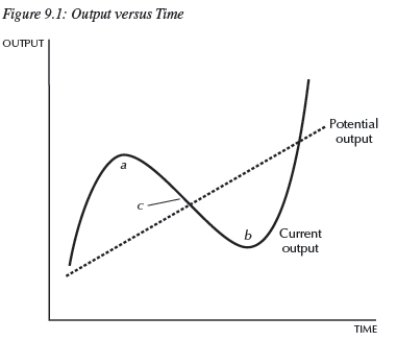
-Consider Figure 9.1.The dashed line is potential output and the solid line is current output;therefore,
A) areas a and b are booms.
B) area b represents an economic boom,and area a is a recession.
C) the economy is in neither a recession nor a boom in areas a and b.
D) area a represents an economic boom,and area b is a recession.
Correct Answer:

Verified
Correct Answer:
Verified
Q5: According to the Phillips curve presented in
Q17: A decline in long-term productivity implies that
Q59: Output fluctuations are defined as:<br>A) the amount
Q67: <img src="https://d2lvgg3v3hfg70.cloudfront.net/TB4305/.jpg" alt=" -Consider the Phillips
Q70: In 1980,the inflation rate reached about 14
Q71: The short-run model determines _ and _.<br>A)
Q73: Defining <img src="https://d2lvgg3v3hfg70.cloudfront.net/TB4305/.jpg" alt="Defining As
Q74: If <img src="https://d2lvgg3v3hfg70.cloudfront.net/TB4305/.jpg" alt="If
Q75: If <img src="https://d2lvgg3v3hfg70.cloudfront.net/TB4305/.jpg" alt="If ,the
Q77: Generally speaking, the rate of inflation rises