Multiple Choice
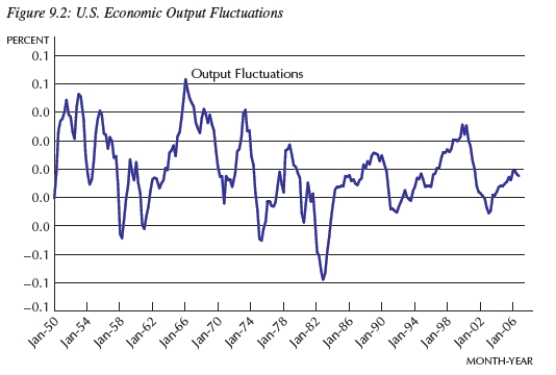
-Consider Figure 9.2.In approximately which of the following years was current output equal to potential output?
A) 1953,1966,1974,1979,and 2000
B) 1954,1961,1975,1983,and 2002
C) 1957,1964,1980,1991,and 2001
D) 1954,1961,1975,1979,and 2000
E) 1953,1966,1974,1983,and 2002
Correct Answer:

Verified
Correct Answer:
Verified
Q13: A country with a steep Phillips curve
Q20: If an economy has a horizontal Phillips
Q36: Taken together, the Phillips curve and Okun's
Q42: Generally speaking,the rate of inflation _ during
Q43: <img src="https://d2lvgg3v3hfg70.cloudfront.net/TB4305/.jpg" alt=" -Consider Figure 9.4,which
Q44: Defining <img src="https://d2lvgg3v3hfg70.cloudfront.net/TB4305/.jpg" alt="Defining As
Q45: Potential output is defined as _.<br>A)the amount
Q46: If current output is <img src="https://d2lvgg3v3hfg70.cloudfront.net/TB4305/.jpg" alt="If
Q49: Defining u as the unemployment rate and
Q51: In 1980,the inflation rate reached about 14