Essay
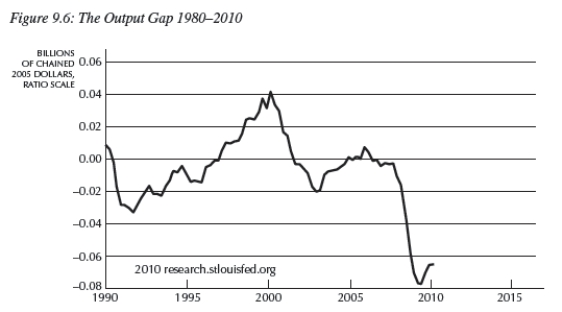
-Figure 9.6 below shows the output gap for the years 1990-2010.Using the Phillips curve and Okun's law,discuss the impacts on inflation and unemployment for the years 1997-2000 and 2008-2010.From this analysis,what is the relationship between unemployment and inflation?
Correct Answer:

Verified
The Phillips curve is the positive relat...View Answer
Unlock this answer now
Get Access to more Verified Answers free of charge
Correct Answer:
Verified
View Answer
Unlock this answer now
Get Access to more Verified Answers free of charge
Q13: A country with a steep Phillips curve
Q20: If an economy has a horizontal Phillips
Q36: Taken together, the Phillips curve and Okun's
Q49: Defining u as the unemployment rate and
Q51: In 1980,the inflation rate reached about 14
Q55: Defining u as the unemployment rate and
Q56: Okun's law shows the _ relationship between
Q57: Current output is defined as _.<br>A)the amount
Q60: What does Okun's law state?
Q71: The relationship between actual output in an